A Few Notes on Doing Meta-analysis
CUI Tianxiang
2022.11.01
Contents
Intro
Preparations
Data Analysis
A Brief Intro
To perform a meta-analysis we compute an effect size and variance for each study, and then compute a weighted mean of these effect sizes.
Topic
The relationship between two constructs
The effect of an intervention
The structure of a model
…
Keywords
- Refer to previous meta-analyses

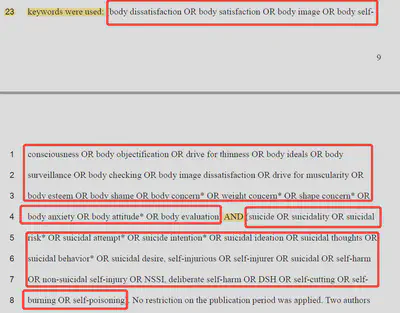
Keywords
Use “*” when variations are needed (e.g., therap* includes therapy, therapies, theraputic, etc.)
Use "" to include pharses (e.g., “body image”)
Use “AND” and “OR” correctly
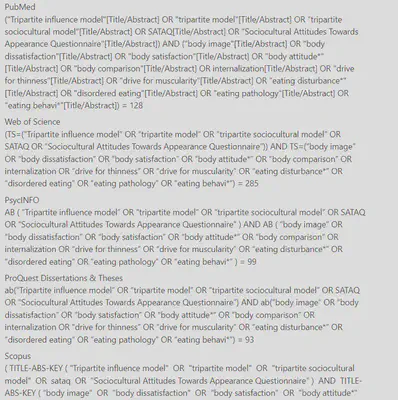
Databases
- PsycINFO, Web of Science, PubMed, Scopus, and ProQuest Dissertations & Theses (PQDT)
- Focus on title and abstract
- Records (with abstract) → files (RIS / Bibtex…) → reference manager (Zotero / Endnote / Mendeley …)
- Google Scholar and included articles (check the references)
Records
- Remove duplicates (Zotero seems to work better, but is not perfect)
- Screen title and abstract of the literature by yourself or cooperate with another student (create a shared library or export half of the literature)
- Download potentially qualified articles
Selection Criteria
General inclusion criteria & exclusion criteria
- Include English articles, exclude review articles and qualitative studies…
Specific criteria
- Depend on the topic
Selection Criteria
- English articles only
- Language restrictions won’t lead to systematic bias (Morrison et al., 2012)
- Unpublished articles (dissertations)
- “Time, effort and cost”
- Easy access, low bias and complete demonstration of findings (Moyer et al., 2010)
- A better representation of missing study (Ferguson & Brannick, 2012)
Record Important Information
- Search results
- Keywords and references
- Time period (you may need to search literature twice or even three times)
- Number of articles (total, after removing duplicates, after checking titles and abstracts, after checking the full texts)
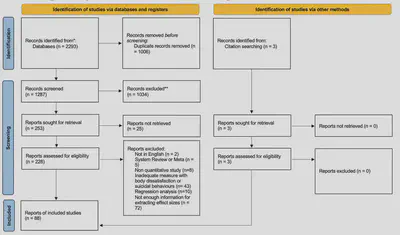
Flow Diagram
Coding
- Author (s) & year
- Publication year
- Publication type
- Country / region
- Mean age
- Study design
- Effect size & variance
- …
Effect Size
Inter-coder Reliability
Two coders (code independently then discuss)
Krippendorff’s alpha (≥ .800)
Quality Assessment
Refer to previous studies when choosing tools
Two coders (code independently then discuss)
Data Analysis
- R & metafor
- Consider a three-level meta-analysis when a single study is likely to contain multiple effect sizes
- Heterogeneity from three levels of variance: the sampling variance of effect sizes, within-study variance, and the between-study variance
- Assink & Wibbelink, 2016
Outliers & Pooled effect sizes
Baujat plots and influential case diagnostics
A pooled effect size with outliers excluded
Forest plot for the effect sizes
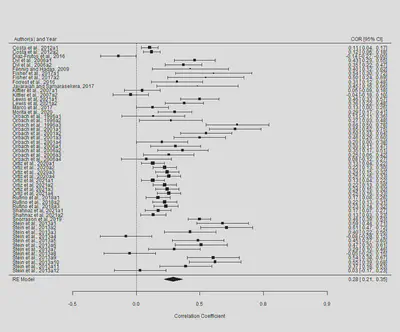
heterogeneity among effect sizes
Q statistics (p < .05) indicate a significant heterogeneity
Meta-regression analyses of potential moderators (age, region, data source, etc.)
For continuous variables, at least 10 effect sizes (Higgins et al., 2019)
For categorical variables, at least 3 effect sizes for the subgroup of a variable
Publication Bias
Funnel plots
The p-uniform* method